CLICK HERE TO DOWNLOAD ACTIVITY 5
CLICK HERE TO DOWNLOAD THE PROPOSAL PRESENTATION TEMPLATE
CLICK HERE TO SUBMIT ACTIVITY 5
Purpose
- Teams will apply what they have learned in previous activities to create their own smart power grid design. Be sure to understand how to calculate the power load of each grid and how power is distributed across the grid. Please refer to previous activities if needed
Instructions
We have researched the current grid, surveyed the energy users in the community, and made decisions on how to restore power after a disaster. We will bring it together and design a new and improved smart grid.
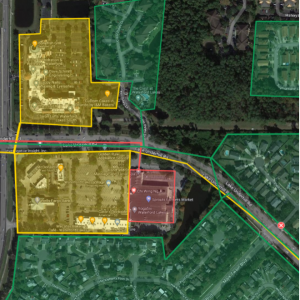
For security reasons, many cities do not publicly share maps of the grid; however, we can approximate that distribution lines follow the same path as all the streets. The first image below shows the impact when a distribution line is knocked down at the red X. All the users in the red area lose power. We can add a backup path using a smart grid so that power can be immediately rerouted.


In the second example image above, the red microgrid is for essential users, including large stores, in this case, Sprouts Farmers Market, for reliable access to supplies or food. The yellow grid contains non-essential, non-residential users. The green grid has residential users. The users’ connection provides backup paths to prevent outages to essential businesses.
Reimagining the Grid
Duke Energy has allotted a power supply of 10 MW (megawatts) for your team to develop a microgrid within a 2-mile radius. Your design team will now identify and map each of the areas within the microgrid to create multiple priority levels in the design. Think about what types of power users are in each priority level.
Creating the Grid
1. Open your Google MyMap from Activity 2: Mapping the System. Create a 2-mile radius circle anywhere within the existing 3-mile radius to install your new grid design.
2. Group the user types to different priority levels, such as shown in the second example image in the Instructions We recommend at least three (green, yellow, and red), but you can have more than three priority levels as you deem fit. Draw polygons to highlight users on the grid in this color. Using the same color as the area, connect users with lines to represent distribution lines. These lines do not have to follow the same path as the streets. Choose a different color for each priority level. Assume that any users outside the 2-mile radius are not powered by the smart grid and will remain on the traditional grid instead. Fill out the table below to help keep track of your groups.
|
User Type |
Priority Level |
Color |
|
|
|
|
|
|
|
|
|
|
|
|
|
|
|
|
|
|
|
|
|
|
|
|
|
|
|
|
|
|
|
|
|
|
|
|
|
|
|
|
3. Paste the map’s Share link here:
Powering the Community
To make the microgrid you just mapped a smart grid, your design team will describe how power will be metered and distributed across the grid and between the priority levels.
4. Brainstorm at least two ways to distribute power across the grid and fill out the tables below with the design specifications. Add rows and tables as needed.
- How much power will be given to each priority level? Use the values from Activity 3 to help you with this one. Try your best to ensure the values throughout the smart grid sum up to less than or equal to the allotted 10 MW from Duke Energy. Will the power supply change (be metered) throughout the day?
- Describe any other features in your design, such as sensors and backup systems, in 1-2 paragraphs using complete sentences.
|
Design 1 |
|||
|
Priority Level |
User Type |
How much power is supplied? (kW) |
When is the power supplied or cycled? |
|
|
|
|
|
|
|
|
|
|
|
|
|
|
|
Design 1 Justification:
|
Design 2 |
|||
|
Priority Level |
User Type |
How much power is supplied? (kW) |
When is the power supplied or cycled? |
|
|
|
|
|
|
|
|
|
|
|
|
|
|
|
Design 2 Justification:
5. After taking a closer look at the map and the users within the radius, which grid design is better? Or did your team create a new design? Fill out the table below with the chosen design. List three reasons to support your selection of the final grid design below:
Three Reasons:
- a)
- b)
- c)
|
Final Design |
|||
|
Priority Level |
User Type |
How much power is supplied? (kW) |
When is the power supplied or cycled? |
|
|
|
|
|
|
|
|
|
|
6. Explain how your design aligns with your calculations and priorities from Activity 3: Estimating Power Load and Activity 4: Prioritizing Power Restoration. Write 1-2 paragraphs using complete sentences.
Preparing the Design Proposal
7. Create a proposal for the new smart grid system, synthesizing information from Activities 1-5. Use the file pptx for further instructions.
After Completion:
- Meet with your team’s mentor to discuss and check your work to make refinements as needed.
- Save this document as a pdf with the title Activity_5_[Team Name].pdf
- Save the proposal as a pptx with the title Draft_Proposal_[Team Name].pptx
- Save the written report as a pdf with the title Report_[Team Name].pdf
- Submit document, proposal, and written report here: https://ufl.qualtrics.com/jfe/form/SV_3wwsZbxwqu39mK2
