CLICK HERE TO DOWNLOAD ACTIVITY 5
CLICK HERE TO SUBMIT ACTIVITY 5
Purpose
- Teams will apply what they have learned in previous activities to translate their smart power grid user prioritizations into at least 3 microgrids within their mapped communities.
- Teams will approximate the power load of each microgrid and justify power distribution across each microgrid system.
Instructions
You have researched the current grid, surveyed the energy users in the community, and made decisions on how to restore power after a disaster. It’s time to bring together what you understand about users in your community to design a new and improved smart microgrid system.
For security reasons, many cities do not publicly share maps of the grid. However, we can approximate that grid distribution lines follow the same paths as all the streets.

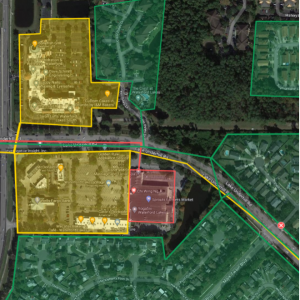
Differently colored polygons enclose users that are connected to different microgrids. The lines interconnecting polygons of a given color represent distribution paths between users of that microgrid.
Reimagining the Grid
Your design team will now group different users geographically through the creation of at least 3 interconnected microgrids within the mapped region of your community. Think about the restoration snapshots you used to train the AI in Activity 4. How can power be distributed among all possible users to make that plan possible? How can you protect your community if one of your microgrids goes down?
Power Consumption for Single Users
When designing your microgrid system, you will calculate the total power load for each microgrid by summing the power load of all the users connected to that microgrid. First, use your data from the Users Power Panel of the PTCHS_24_Activity 4 spreadsheet to calculate the average maximum power demand of a single user of each type.
|
User Type |
Total User Power Consumption (kW) (PTCHS_24_Activity 4.xlxs Normal Max Power – Cells C3:C12) |
Total # of Users |
Single User Power Consumption (kW) (Normal Max Power/Total # of Users) |
|
Gas Station |
268 |
2 |
(268/2) = 134 |
Creating Microgrids
- Open your Google MyMap from Activity 2: Mapping the System.
- Group all the user buildings throughout your mapped community into at least three different microgrids, as show in the image above. Choose a different color for each microgrid, so that the different microgrids appear interspersed throughout the entire radius you choose. We recommend at least three microgrids (e.g., green, yellow, and red), but you can have more if you deem fit. You can only have 10 layers total in your MyMaps, so please follow the instructions below carefully.
- Change Base Map to Satellite so that you can see the buildings and streets that make up the users in your community.
- Select the layer of your map that already has the color you want to use for a microgrid. The shapes representing a single microgrid must all be part of the appropriately colored layer. Make sure that the layers you choose for your microgrids are not the layer containing your circular region, so that the colors are easily distinguishable.
- Select Draw a line then Add line or shape to bring up the line-drawing cursor. Click from point-to-point to draw lines on your map that enclose a polygon, highlighting surrounded users in the polygon of that layer’s color.
- To enclose a polygon, make sure your last line ends on the starting point of that polygon.
- Once you have finished a polygon, it will appear as an object under the selected layer.
- You must select Draw a line again to create a new polygon.
- Using the same color as the enclosed polygons (i.e., while the same layer is selected), connect the regions of the microgrid with lines to represent distribution lines of that microgrid. These lines do not have to follow the same path as the streets.
- To draw a single line connecting two polygons, click again on the second point of that line.
Powering Your Community
- To make the microgrid system you just mapped a smart grid, your design team will describe how power will be metered and distributed across the different microgrids, so that geographical constraints can be balanced with your plan for AI to maintain important priorities. Fill out one table below for each microgrid you created. *Add Rows as needed
- (Row 2, Column 1) What color did you use for that microgrid?
- (Columns 1, 2, 3) Keep track of how many users of a given type were divided into that microgrid. Different microgrids may each include some users of the same type, based on the geographic distribution in your community.
- (Column 4) Calculate the load for all the users of a given type that are connected to that microgrid. Use the values you obtained earlier in Power Consumption for Single Users.
- (Row 2, Column 2) What is the total power load for that microgrid? (Sum the Power Supplied column)
|
EXAMPLE Microgrid A |
||||
|
Color: Red |
Total Load (kW): 1275 |
|||
|
User Type |
Initial Priority Rank (Act 2) |
User Count |
Power Supplied (kW) |
Local User Names |
|
Gas Station |
4 |
3 |
402 |
Shell, Marathon |
|
Fast Food |
7 |
2 |
873 |
McDonald’s, Taco Bell |
|
Microgrid 1 |
||||
|
Grid Color: |
Total Load (kW): |
|||
|
User Type |
Initial Priority Rank (Act 2) |
User Count |
Power Supplied (kW) |
Local User Names |
|
|
|
|
|
|
|
|
|
|
|
|
Microgrid 1 Justification:
Provide a justification for the design of your microgrid, in 1–2 paragraphs using complete sentences. Be sure to address the following questions in your responses: Why did you group certain users together within this microgrid? What will happen if any of the other microgrids go down?
>
|
Microgrid 2 |
||||
|
Grid Color: |
Total Load (kW): |
|||
|
User Type |
Initial Priority Rank (Act 2) |
User Count |
Power Supplied (kW) |
Local User Names |
|
|
|
|
|
|
|
|
|
|
|
|
Microgrid 2 Justification:
Provide a justification for the design of your microgrid, in 1–2 paragraphs using complete sentences. Be sure to address the following questions in your responses: Why did you group certain users together within this microgrid? What will happen if any of the other microgrids go down?
>
|
Microgrid 3 |
||||
|
Grid Color: |
Total Load (kW): |
|||
|
User Type |
Initial Priority Rank (Act 2) |
User Count |
Power Supplied (kW) |
Local User Names |
|
|
|
|
|
|
|
|
|
|
|
|
Microgrid 3 Justification:
Provide a justification for the design of your microgrid, in 1–2 paragraphs using complete sentences. Be sure to address the following questions in your responses: Why did you group certain users together within this microgrid? What will happen if any of the other microgrids go down?
>
Final Microgrid Design
Paste a picture of your final map, showing your designed microgrid system.
Bringing it all Together
Explain how your microgrid design makes it possible to account for different user type priorities from Activity 2: Mapping the System. Explain how your microgrids can be managed using your AI-training snapshots from Activity 4: Training Your Smart Grid. Write 1-2 paragraphs using complete sentences.
>
After Completion:
- Meet with your team’s mentor to check your work and make changes as needed.
- Save this document as a PDF with the title Activity_5_[Team Name].pdf and then have your Quality Engineer submit your PDF here: https://ufl.qualtrics.com/jfe/form/SV_3wwsZbxwqu39mK2

