![]()
CLICK HERE TO DOWNLOAD ACTIVITY 3 WORD DOCUMENT
CLICK HERE TO DOWNLOAD ACTIVITY 3 FLOW DIAGRAM POWERPOINT
CLICK HERE TO SUBMIT ACTIVITY 3
Activity Tutorial
purpose
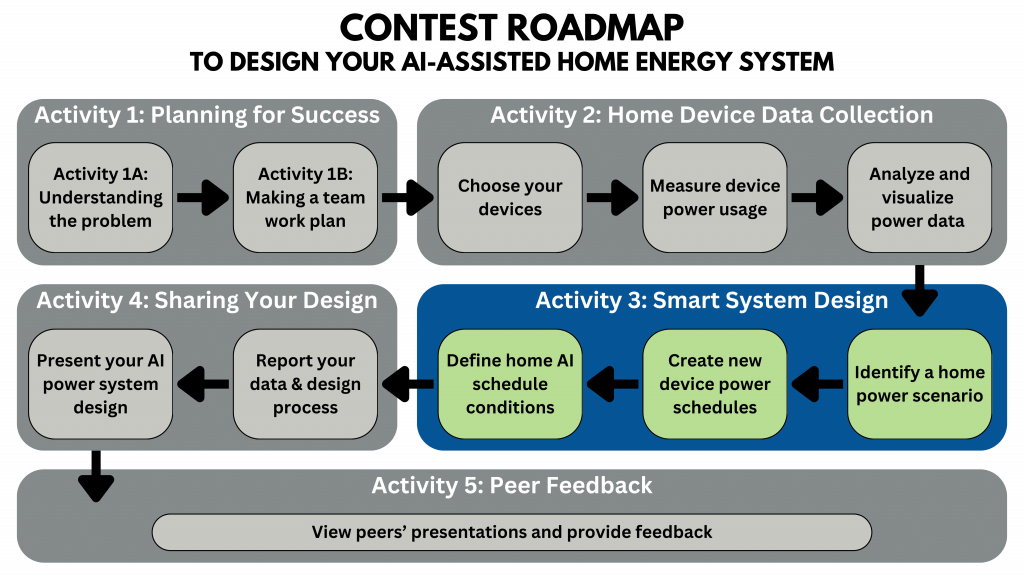
- Teams should use this activity to translate quantitative and qualitative understanding of power usage and energy consumption to design for smart energy management.
- Learn how demand-based variations in the cost of electricity can influence strategies for improving device operation schedules
- Design a new power schedule for home devices that address power usage and energy consumption goals for a real-world scenario
- Model the use of data and conditions to understand how AI ideas and concepts can be used to control device operations
Part 1: Time-Based Changes in the Cost of Electricity
Duke Energy offers a “time-of-use” cost schedule that allows homes to pay different prices for electricity based on when they use that electricity. Over a 24-hour day, electricity is cheaper at times when most homes need more power at that time, and it is more expensive when most homes need less power at that time.The graphic below shows an example of how Duke Energy sets different electricity prices at different times of the day. This graphic shows that energy is most expensive during “on-peak” hours, shown in orange, and least expensive during “off-peak” hours, shown in blue. Energy purchased during “shoulder rate” hours, shown in yellow, is priced in between.
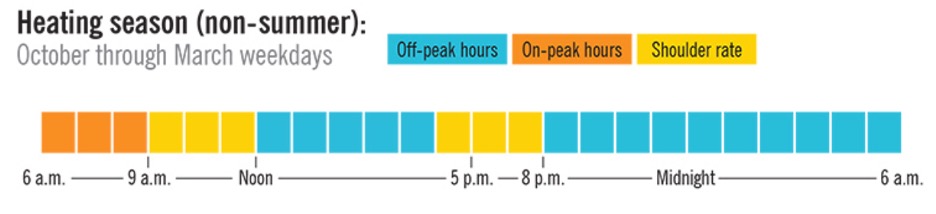
Copyright: https://www.duke-energy.com/business/billing/time-of-use-rate/how-it-works
Instructions: Answer questions 1–5 by comparing the “on” time slots of the power schedule you completed in Activity 2 to the Duke pricing schedule above. Consider all 8 of your devices.
- Which of your devices were turned on during “on-peak” hours?
- Which of your devices were turned on during “shoulder rate” hours?
- Which of your devices were turned on during “off-peak” hours?
- Did different types of devices consume energy with different prices? Explain what patterns you observed.
- How could you change the power schedule of your devices to lower your home’s electricity bill? Give specific examples based on the “on” time slots you recorded for your different devices.
Part 2: Designing Goals and a Power Schedule for a Home Scenario
To design for smarter energy management, you can develop a new “on”/“off” power schedule for how your home’s devices operate during different home scenarios. To do this, you have to create goals for the total power usage and energy consumption of your home’s devices in response to a specific scenario.
Choosing a Home Scenario
Instructions: To design your smart energy management system, choose between the two types of home scenario: 1 or 2. In the following section, you will create quantitative goals for your home’s power usage and energy consumption that fit your scenario.
Types of Home Scenarios:
- Planning Changes in Energy Cost: You will identify design goals related to how much money the electricity used by your home costs. Think about some of these questions:
- Which of my devices consume the most total energy over a 24-hr period?
- During which time windows does my home consume the most total energy?
- Which devices cost my home the most money over a 24-hr period?
- At which times of day is the total cost of my home’s electricity the most expensive?
- How can I reduce the values related to questions a–d?
- Planning Changes in Power Distribution: You will identify design goals related to how your different devices share the power provided to your home. Think about some of these questions:
- Which of my devices have the highest power usage?
- During which time windows is the total power usage of my home the highest?
- Can I reduce my home’s total power usage by operating certain devices at different times?
- How does changing when my devices are on or off change the way power is shared by the devices in my home?
Transferring Your Initial Power Schedule
- Write the scenario you chose (type 1 or 2) in the space below.
- Open the “PTCMS_25_2_Graphing Power Schedules” Excel spreadsheet from the “Activity 2” folder and select the “Initial Power Schedule” tab.
- Left click in cell C3, then hold and drag your cursor to cell J26, so that all your initial data from the table in tab 1 is selected. Right click anywhere in the highlighted area and select “Copy”.
- Select the “New Power Schedule” tab of the spreadsheet.
- Left click cell C3 (gold) of that spreadsheet to select the cell, then right click and select “Paste”. This will transfer your data from the “Initial Power Schedule” tab into an identical table in the “New Power Schedule” tab.
- The rest of your table (column K and row 27) should automatically populate, and the “New Power Schedule for Home Devices” graph will automatically update. Now, the “New Power Schedule” tab just shows a copy of your initial power schedule and the same graph that you made in Activity 2.
Designing a New Power Schedule for Your Home Scenario
Instructions: Complete questions 1–4 to guide you through designing and graphing a new power schedule for the home scenario you chose. This will help you figure out how your new power usage and energy consumption goals require you to make changes to:
- The energy consumption values that you calculated using Table 2.3 in Activity 2
- The features of power usage that you graphed in Activity 2
- Answer parts 1–8 to explore how you can change the “on”/“off” time slots of your 8 home devices. You will need to think about the quantitative relationships between (1) individual device power, (2) total home power, (3) individual device 24-hr energy, (4) total home energy, and possibly (5) cost.
- What are your new goals for the total power usage of all 8 devices? Explain how these goals came from your scenario.
- To reach your total power usage goals, what features of your graph need to change, and how?
- How can changing the “on”/”off” time slots of your devices change your graph to meet your new power usage goals?
- How do your answers to parts 1–3 change the way power is shared by the devices in your home?
- What are your new goals for the total energy consumption of all 8 devices? Explain how these goals came from your scenario.
- To reach your energy consumption goals, how does the data you recorded and calculated in Table 2.3 (from Activity 2) need to change?
- How can changing the “on”/”off” time slots of your devices change the energy consumption data you calculated in your power schedule table (Row 27) to meet your new energy consumption goals?
- How do your answers to parts 5–7 help you change the cost of electricity in your home?
- Create your new power schedule by changing the data table and graph in the “New Power Schedule” tab of your spreadsheet.
- Based on your answers to question 1, enter the “on” and “off” power values of your devices from Activity 2 into new time slots in the data table.
- As you change the time slots of your devices to meet the goals of your scenario, the Total Power usage (column K) and Total 24-hour Energy consumption (row 27) will change. This means the graph of your initial power schedule will be changed into the graph of your new power schedule.
- Try out different time slots to obtain values and graph features that meet your scenario-specific goal
- In the space below, copy and paste the final graph of your new power schedule
- Fill out Table 3.1 on the following page to show the new power schedule for your home scenario. You can copy the corresponding cells directly from your spreadsheet table in the “New Power Schedule” tab. Type the number of the scenario you chose in the title (first row) of Table 3.1.
Table 3.1: New Power Schedule for Scenario ____ |
|||||||||
| Start (hr) | End (hr) | Dev 1 (W) | Dev 2 (W) | Dev 3 (W) | Dev 4 (W) | Dev 5 (W) | Dev 6 (W) | Dev 7 (W) | Dev 8 (W) |
| 0 | 1 | ||||||||
| 1 | 2 | ||||||||
| 2 | 3 | ||||||||
| 3 | 4 | ||||||||
| 4 | 5 | ||||||||
| 5 | 6 | ||||||||
| 6 | 7 | ||||||||
| 7 | 8 | ||||||||
| 8 | 9 | ||||||||
| 9 | 10 | ||||||||
| 10 | 11 | ||||||||
| 11 | 12 | ||||||||
| 12 | 13 | ||||||||
| 13 | 14 | ||||||||
| 14 | 15 | ||||||||
| 15 | 16 | ||||||||
| 16 | 17 | ||||||||
| 17 | 18 | ||||||||
| 18 | 19 | ||||||||
| 19 | 20 | ||||||||
| 20 | 21 | ||||||||
| 21 | 22 | ||||||||
| 22 | 23 | ||||||||
| 23 | 0 | ||||||||
Part 3: Modeling Controls for an AI Energy Management System
A smart energy management system can use AI to automatically create and update a device power schedule, based on data it collects from your devices and the power/energy goals you create for your home. For AI to do this, it needs to know how you, the user, want it to make decisions. You can teach AI to make decisions by creating conditions for how the AI uses your data to turn devices “on” or “off”. One way to model the relationship between your data and conditions is by using a flow diagram.
Creating a Flow Diagram for Your AI
Instructions: Referencing the new power schedule you made in Table 3.1, you will enter your conditions and device data into the empty flow diagram to show how your devices should operate during the home scenario you chose.
- Open the PowerPoint file called “PTCMS_25 _3_Flow Diagram”.
- Follow the instructions on the first slide to fill out the flow diagram model on the second slide.
- Once your flow diagram is complete, paste a screenshot of it below. Later, you can copy the PowerPoint slide you created and paste it into your final design presentation.
Part 4: Summarizing Your Findings
Instructions: In the space below, write a 1-3 paragraphs that summarize what changes you made to create the power schedule for your scenario. Explain how these changes looked in your new graph. Explain how the conditions you create for your AI will make sure these changes take place.
Part 5: Submit this Activity
- Meet with your team’s mentor to check your work and make changes as needed.
- Save this document as a PDF with the title Activity_3_[Team Name].pdf
- Have your Quality Engineer submit your PDF here: https://ufl.qualtrics.com/jfe/form/SV_eQaBRiCJA8MfQUe